


SINGAPORE (Oct 4): The Straits Times Index is approaching its Aug 28 low of 3,056 as short- and medium-term indicators are becoming increasingly oversold. Quarterly momentum is at a one-year low. This could provide some support in due course. In the immediate term though, sentiment remains poor and quarterly momentum may test a new one year low first before rebounding.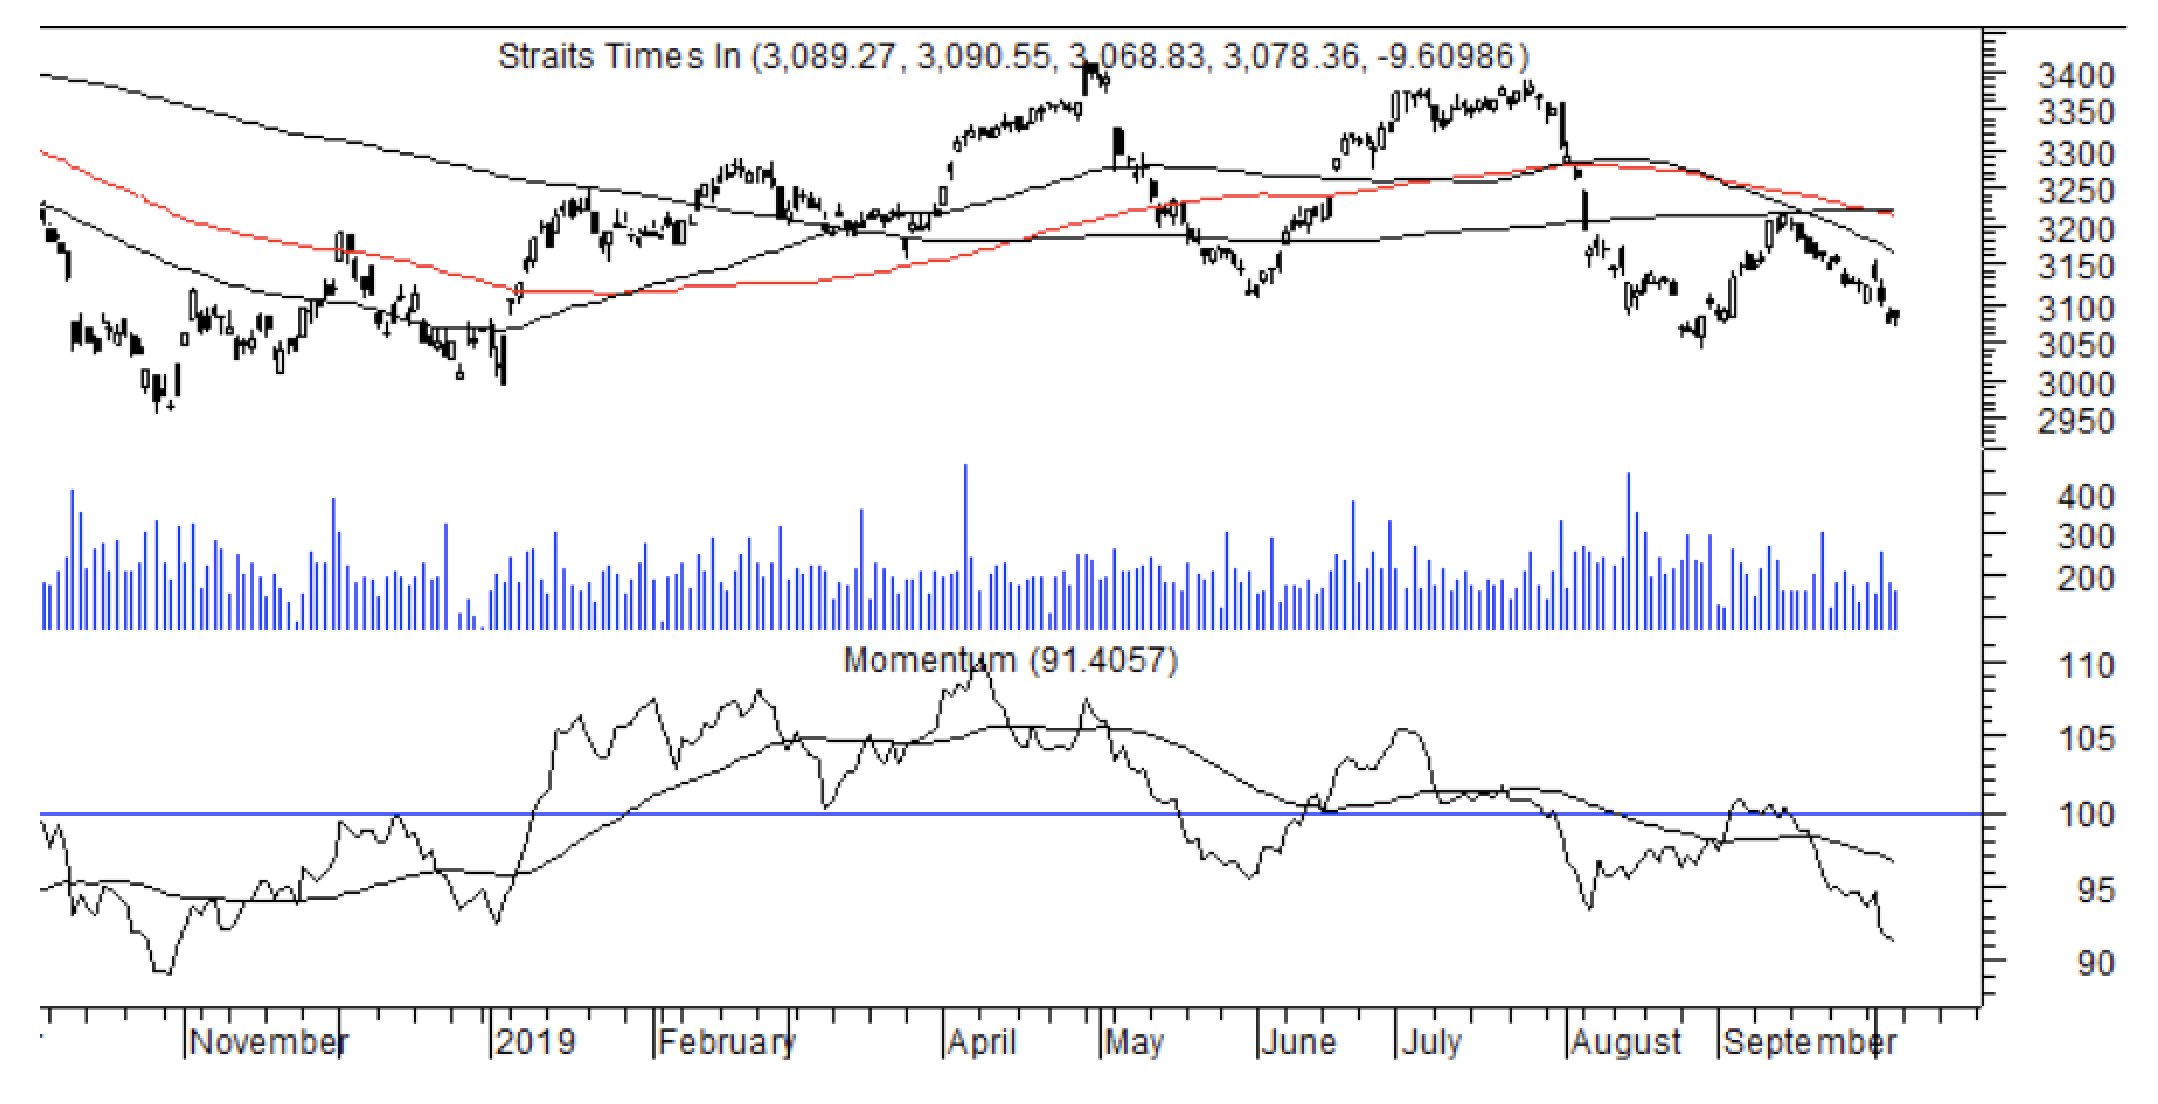
Chart 1: STI with moving averages and momentum
'The 100- and 200-day moving averages have made a negative cross at 3,216. Immediate resistance is lowered to the declining 50-day moving average at 3,162. Although volume picked up marginally, its trend is still falling suggesting no major increase in selling pressure. During the week of Oct 7-11 prices could reach a low point and rebound.
Chart 2: Short term indicators

Short term stochastics is closing in on the low end of its range and should reach this level within the next three trading sessions. The 21-day RSI is falling, but it hasn’t reached the low end of its range yet. ADX is turning up as the DIs are negatively placed, suggesting that selling pressure is creeping up. The chart pattern shows the index breaking below a minor support at 3,100, indicating a downside of 3,000. Whether this is attained remains to be seen as indicators would be severely oversold by then.


