Despite our trust, banks come and go with unsettling regularity but we are often given the impression that this is a problem unique to China. The current banking problems in four rural banks in Henan province and one in neighbouring Anhui are reported as though they are the start of a systemwide banking collapse and proof that the Chinese economy is collapsing.
The largest banking system failures did not come from the Global Financial Crisis. They came from the Saving and Loans Crisis in the US that extended for more than a decade from the 1980s to the 1990s. One-third of the 3,000 savings and loans “banks” failed, taking the money, hopes and dreams of depositors with them. In the same period, more than 1,600 traditional banks failed. The US government bailout cost more than $105 billion but there was still an estimated $132 billion lost by depositors.
The “Wild West” attitude among some banks led to outright fraud is a problem not unique to China. It is estimated that as many as 400,000 customers across China were unable to access their savings at the rural banks in Henan and Anhui provinces. This compares with the more than estimated 2.5 million customers who found themselves in the same situation during the US crisis.
At the time of the Savings and Loans crisis, the GDP of the US was around US$4.3 billion. However, the Dow Jones Index rose more than 900% during this time.
See also: Taiwan may push back timeline to meet green energy goal after missing it last year
This gives a better perspective and context in which to consider the current Chinese banking problems. China’s GDP is around US$14.72 billion ($20.35 billion) or 3.5 times larger than the GDP of the US during its banking crisis. This would suggest there is ample room within China’s economy and GDP to absorb a banking problem that is currently estimated to be around US$9 billion. The standalone figure is large but not particularly significant when compared to the estimated $50 trillion in assets in the Chinese banking system.
Unlike the US banking system, in China, deposits up to RMB500,000 ($102,700) are guaranteed in the event a bank fails. The main issue of concern is that this does not include other banking and financial products such as high-interest rate savings accounts. Like all banks worldwide, Chinese banks have pushed depositors to buy many different types of investment accounts and products — often mistakenly believed to be guaranteed by the banks themselves.
If a government investigation finds that these products are “noncompliant”, they will not be covered by the deposit insurance scheme.
See also: CK Hutchison seeks damages via arbitration on Panama Ports
Despite the hysteria generated by the “China is collapsing” school of analysis, the current banking problems are on a scale much smaller than that experienced by the US. The collapse of some local banks will cause localised discontent — just as it did in the US — but this is unlikely to be a precursor to a generalised collapse of the banking system.
Technical outlook for the Shanghai market

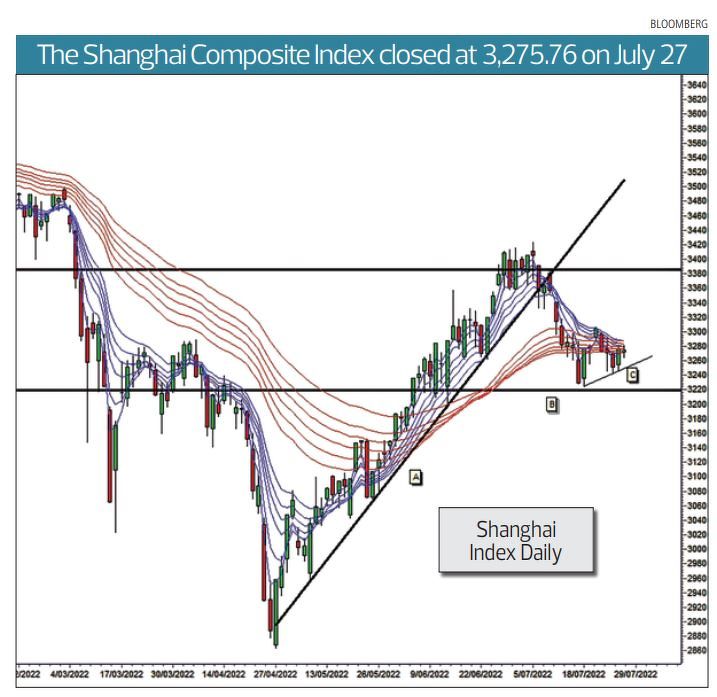
The Shanghai Index is consolidating slightly above the historical support level near 3,220. There is conflicting evidence about the potential trend direction.
The Guppy Multiple Moving Average (GMMA) relationships show downward selling pressure but they do not show a strong downtrend development.
For more stories about where money flows, click here for Capital Section
The successful tests of the support area are often associated with a successful rebound and the potential to develop a new uptrend. This lack of clarity in trend direction suggests that both traders and investors will wait until the trend direction is confirmed.
The bulls will look for these features:
- A rebound rally from the support level.
- A rebound from the potential uptrend line is shown as line C.
- The short-term GMMA compressing and moving above the long-term GMMA < A.
- Compression in the long-term GMMA and a turn upwards.
- The upside target is near 3,380.
For the rebound to succeed and develop into an uptrend continuation, it needs to close above the value of the upper edge of the short-term group of averages near 3,300.
The bears have a different perspective. They look for these features:
- A close below the support level near 3,220.
- The short-term GMMA moving completely below the long-term GMMA
- The long-term GMMA compressing and turning downwards
- The upper edge of the long-term GMMA moving below the support level near 3,220.
- The downside target is near 3,040 but this is weak support.
Uptrend line A remains important. For several months, it acted as a support feature. In future, it will act as an additional resistance feature. If the market can rebound and move above historical resistance near 3,380, the value of trend line A will act as an additional resistance point to slow any future rally.
The leading indicator of a sustainable rebound is when the short-term group of moving averages compress near the lower edge of the long-term group of moving averages. This is an indication that aggressive traders are entering the market in anticipation of a market rebound and rally. Currently, the key feature to watch is the index behaviour as support is tested.
Daryl Guppy is an international financial technical analysis expert and special consultant to AxiCorp. He has provided weekly Shanghai Index analysis for mainland Chinese media for two decades. Guppy appears regularly on CNBC Asia and is known as “The Chart Man”. He is a national board member of the Australia China Business Council. The writer owns China stock and index ETFs


