


Technically, a minor negative divergence has appeared between HKL’s share price and its 21-day RSI. On the weekly chart, annual momentum and the 13-week RSI are at 10-year highs. This does not mean that prices can’t go higher. They probably can. However, in the immediate term, on the weekly candlestick chart, a large shadow has appeared on top of a small body, which may imply that prices have run ahead of themselves. The top of the shadow is at US$7.45. Support for HKL is at US$6.

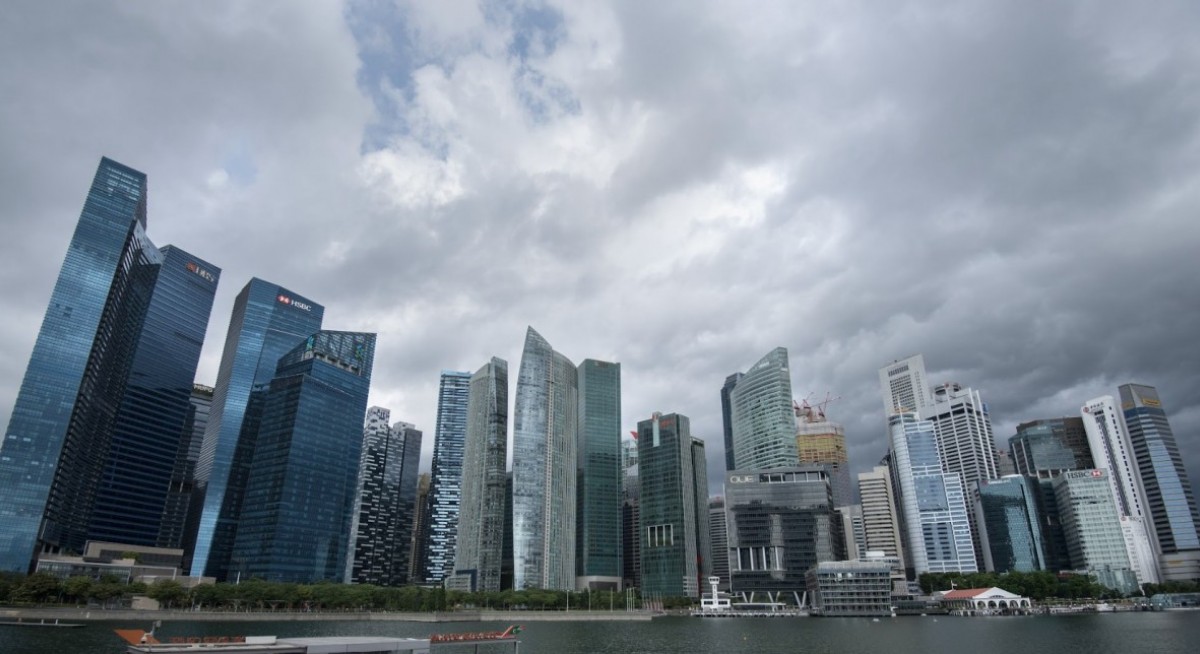
The uptrend of the Straits Times Index has started to resemble a staircase, which implies that the uptrend can persist for some time. However, immediate moves could be lower as the index takes a breather. Support is at 4,240, a tad below the rising 50-day moving average at 4,247, and the breakout level of the ascending triangle at 4,280. The breakout indicates an upside of 4,500 which remains valid.

See also: STI appears set for 5,740 as firmer interest rates stymie REIT index
The FTSE REIT Index almost met its upside of 720 and it too has retreated. Support appears at its rising 50-day moving average at 681. The REIT Index ended the week of Sept 15-19 at 698.
The yield on the 10-year Singapore Government Securities has risen from 1.77% on Sept 18 to 1.80% on Sept 19. This may be just a blip. However, the global tech giants have announced large investments in the US, eg the US$500 billion Stargate project, and in the past week of Sept 15-19, talk of investing GBP155 billion in the UK has emerged. Whether this drains liquidity from the local market remains to be seen.


