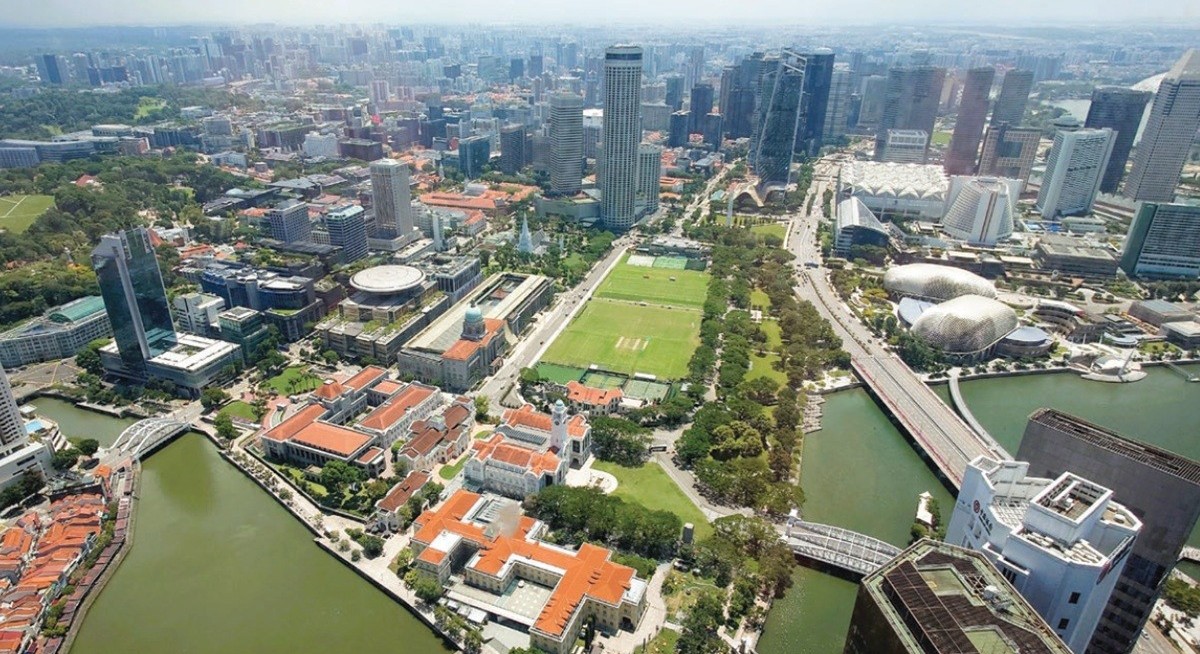


Singapore’s REIT market: a genuine achievement
With 41 listed S-REITs and property REITs and approximately US$80 billion ($101.78 billion) of market value, Singapore ranks third in Asia Pacific behind Australia’s 44-strong A-REIT sector at US$120 billion and Japan’s 58 listed J-REITs at US$105 billion (see Chart 1). Singapore built this position deliberately, through a combination of targeted tax incentives, a regulated gearing framework, and a governance architecture that attracted sponsor-grade platforms from across the region over two decades. That achievement is real and should be recognised as such.

The sector’s headline profile supports the confidence of investors who have been drawn to it. The average distribution yield across 38 active REITs (excluding three suspended REITs) is 5.9%, against a STI index yield of 4.6% and a Singapore 10-year government bond yield of 2.1% as at end-2025 (see Chart 2).
See also: S-REITs’ shopping spree pushes 1H2026 acquisitions value to highest since 2021: RHB

On yield alone, S-REITs offer a premium over every comparable listed or fixed-income alternative available to a Singapore retail investor. The FTSE ST REIT Index also offers meaningful portfolio diversification: its price correlation with US equities over the period January 2012 to December 2025 is effectively zero at negative 0.17, making S-REITs a structurally different asset from the equity indices that dominate most retail portfolios.
The headline, in other words, earns its place. But headlines are averages, and in a sector of 41 REITs spanning industrial warehouses in Singapore, office buildings in Houston, retail malls in China, and data centres in Frankfurt, a single average yield number conceals more than it reveals.
See also: JD.com-backed group close to Singapore REIT IPO filing — Bloomberg
Two types of investors, two different questions
Growth investors assess a company on its ability to generate returns above the cost of capital, reinvest those returns profitably, and compound equity value over time. Return on equity against cost of capital is the appropriate primary screen, and the framework applied in this series to the broader SGX market reflects that.
Yield investors ask a structurally different set of questions. They want to know whether the income stream is real and sustainable, whether the balance sheet can withstand a refinancing cycle or a property revaluation without threatening distributions, whether the income they receive today will be higher or lower in three years, and whether they can enter and exit a position at scale without distorting the market. These are income metrics, not equity metrics, and they require a different analytical lens.
S-REITs are yield instruments by design. Singapore’s regulatory regime requires REITs to distribute at least 90% of their taxable income to unitholders. That structural payout obligation suppresses retained earnings, making return on equity a misleading screen.
Two REITs advertising a 6% yield can represent entirely different propositions: one backed by conservative gearing, strong interest coverage, and a three-year record of growing distributions; the other with leverage close to the regulatory ceiling, thin interest cover, and distributions that have fallen for two consecutive years. Knowing only the yield number tells you what a REIT is paying today. It tells you nothing about whether that payment will still be there tomorrow.
The REITs grading framework applied in this analysis assesses all 41 S-REITs and property REITs across five dimensions specific to yield investors: current income delivery, balance sheet safety, market liquidity, valuation credibility and the trajectory of distributions per unit over time.
Each dimension is scored against thresholds anchored to MAS regulatory limits and institutional market standards, producing a composite quality grade for each REIT. The framework is not designed to rank marketing narratives. It measures what a yield investor actually needs before committing capital. The results divide the sector into four cohorts that look very different from each other, and very different from the 5.9% headline.
Sink your teeth into in-depth insights from our contributors, and dive into financial and economic trends
Four cohorts, not one sector
Four REITs (9.8% of the listed universe) qualify as institutional grade. They are CapitaLand Ascendas REIT, CapitaLand Integrated Commercial Trust, Frasers Centrepoint Trust and Mapletree Industrial Trust. Together, they account for $41.4 billion, or 40.5% of total S-REIT market capitalisation. Their average daily trading volume is $35 million per REIT. They offer distribution yields between 4.8% and 6.2%, trade at an average of 1.1x book value, carry gearing well within the MAS regulatory ceiling of 50% of total assets, have an average interest coverage ratio of 3.7x with stable or growing distributions per unit over the measurement period. These are the REITs that institutional mandates can build and exit at scale. The institutional fund flow data confirms where serious capital is concentrated (see Chart 3).

Twelve REITs (29.3% of the universe) are selective income, holding $39.5 billion or 38.5% of sector market capitalisation and trade slightly below book at 0.90x. These names meet most institutional criteria, with an average daily trading volume (ADTV) of $8.6 million per REIT, but carry visible weaknesses in one or two dimensions that a serious investor would examine closely before committing capital.
Keppel REIT scores well on income and liquidity but carries gearing of 47.9%, leaving limited headroom to the regulatory ceiling. Frasers Logistics and Commercial Trust offers a 6.0% yield and reasonable liquidity, but its distributions have declined from 7.68 cents per unit in FY2021 to 5.95 cents in FY2025, a 23% reduction over four years and a meaningful erosion for an investor who bought the REIT expecting stable income. Mapletree Pan Asia Commercial Trust shows a similar pattern, with distributions falling from 9.61 cents in FY22/23 to 8.02 cents in FY24/25. These REITs remain accessible to institutional capital but with conditions attached. The income trajectory dimension is what separates the genuinely reliable from the selectively acceptable.
Fifteen REITs (36.6% of the universe) are fragile income, holding $18.4 billion or 18.0% of sector market capitalisation. The market has already reached a verdict on this cohort: the average price-to-book ratio is 0.77x, meaning assets are priced below stated book value.
CapitaLand China REIT offers a 6.6% distribution yield, but its distributions have fallen from 8.73 cents per unit in 2021 to 4.82 cents in 2025, a 45% decline over four years, while trading at only 0.60x book value. The yield looks attractive. The income behind it has been quietly shrinking. Lendlease Global Commercial REIT offers a 5.0% yield but carries gearing of 42.7% and an interest coverage ratio of only 1.6x, among the thinnest in the sector, trading at 0.78x book value. These REITs are not undiscovered. They are correctly priced.
Ten REITs (24.4% of the universe) are distressed or non-investable, holding a combined $3.1 billion or 3.0% of sector market capitalisation with an average price/book ratio of 0.42x. Three are suspended with no distributions and no investable status: Dasin Retail, Eagle Hospitality and EC World REIT.
Among the active names, Manulife US REIT carries a debt/asset gearing ratio of 56.2%, already above the standard regulatory ceiling, a direct consequence of the structural deterioration in the US office market that has impaired asset values without a corresponding reduction in debt. Keppel Pacific Oak US REIT and Prime US REIT carry gearing between 44% and 47% with interest coverage at 2.5x and 1.6x respectively. The distress in the US office names reflects a global asset-class problem as much as a REIT-specific failure. The consequence for unitholders is identical regardless of cause.
The two fault lines
Two structural findings explain, in quantifiable terms, the persistent divergence between institutional and retail fund flows.
The first is balance sheet concentration near the regulatory limit. Sixteen of the 41 REITs (39% of the sector) carry debt-to-asset ratios at or above 42% or interest coverage ratios at or below 2.0 times. The MAS regulatory ceiling on REIT gearing is 50% of total assets, a limit designed to protect unitholders from excessive leverage risk. A REIT at 42% to 47% gearing has limited capacity to absorb downward property revaluations, higher refinancing costs, or operating income shortfalls before approaching that boundary. In a higher-for-longer rate environment, that headroom is not a theoretical concern. It is a present one.
The second fault line is distribution erosion. Twenty REITs are either suspended, carry zero distributions, or have seen distributions decline at a rate exceeding 6% annually over the measurement period. A further three show visible but less severe income erosion. Together, 23 of the 41 REITs (56% of the sector) are not delivering stable or growing income to their unitholders. The sector’s 5.9% average yield is a real number but it is produced primarily by the minority of REITs that are performing. For more than half the sector, the income delivered falls meaningfully short of what the sector average implies.
The scale paradox
Singapore has built the third largest REIT market in Asia Pacific. A single data point captures both the achievement and its limits. DBS Group Holdings alone has a market capitalisation of $166 billion and generates average daily trading volume of $293 million. All 41 S-REITs combined have a market capitalisation of $102 billion and generate total daily trading volume of $289 million. The entire sector that Singapore spent two decades constructing trades at a lower daily volume than one bank. That is a measure of the sector’s scale relative to the broader market, not a criticism of its existence. But it frames what follows.
Within the S-REIT sector, the concentration is more striking still. The four institutional grade REITs generate $139 million of the sector’s S$289 million in daily trading (or $34.65 million per average Grade-A REIT). Under 10% of listed REITs account for 48% of all S-REIT trading activity.
At the other end, the 10 distressed or non-investable REITs generate a combined average daily volume of $1.7 million (0.6% of all S-REIT trading activity, $170,000 per average distressed REIT). On a per REIT basis, the ADTV of an institutional grade REIT is about 204 times that of a distressed/non-investable REIT.
The practical implication is direct: institutional capital can only access S-REITs at scale through the top cohort. The lower three cohorts, holding 90.2% of all listed REITs by number of listed names, exist in a liquidity environment that makes meaningful institutional participation structurally impractical.
This is why the four REITs at the top hold 40.5% of total sector market capitalisation and 48% of daily trading value despite representing under 10% of listed names. Capital flows to where it can operate. And for most of Singapore’s REIT sector, it cannot.
The policy conversation that has not happened
Singapore’s recent fiscal interventions for the REIT sector have been genuine and sustained. Budget 2025 extended two core S-REIT income tax concessions, the tax exemption on qualifying foreign-sourced income (FSIE-REIT) and the 10% final withholding tax on S-REIT distributions to qualifying foreign non-individual investors, from their original Dec 31, 2025 sunset to Dec 31, 2030, and separately broadened tax transparency treatment to cover all co-location and co-working income from July 1 2025. PwC Singapore has described these explicitly as measures to “provide continued certainty to the market and support Singapore’s position as the preferred listing location for REITs in the Asia Pacific”. The government has not abandoned the sector it built.
The broader equity market revitalisation agenda, however, is oriented toward a different objective. The Equity Market Development Programme (now expanded to $6.5 billion with $3.95 billion deployed across nine asset managers), the Value Unlock programme, the planned SGX-Nasdaq dual listing bridge and the new corporate listing incentives are all primarily aimed at attracting growth capital, new listings, technology companies and the global growth investor constituency that Singapore has historically underserved relative to exchanges such as Nasdaq or Hong Kong. That is a legitimate and necessary ambition. Singapore’s capital market identity cannot remain anchored solely to yield and income.
The concern is not that this growth agenda is wrong. It is that in pursuing it, a specific question about the income sector has gone unasked. The MAS Equities Market Review Group’s published measures address shareholder engagement, retail liquidity access, investor protection and market structure broadly. None specifically addresses distribution sustainability, balance sheet headroom near the regulatory ceiling or the quality stratification documented here.
To be precise about what this means: tax certainty and liquidity support are genuine contributions to the sector’s competitiveness as a listing venue. They are not instruments for restoring declining distributions, reducing gearing in over-leveraged REITs or attracting institutional capital that has already reached a quality verdict. The income infrastructure question and the listings competitiveness question are related but they are not the same question. Only one is currently being asked. That is the gap.
To be clear about what asking that question would and would not require: the structural problems in the lower cohorts, gearing too close to the regulatory ceiling, distributions in decline, and interest coverage too thin to absorb a refinancing shock are ultimately problems that only boards and managers can fix. No grant programme or tax concession changes the arithmetic of a REIT carrying 47% gearing in a higher-rate environment.
What policymakers can do is set the standard by which the sector is measured and held publicly accountable. The Tokyo Stock Exchange’s 2023 initiative, which required companies trading below book value to publish specific improvement plans and named those that did not respond, moved the dial on corporate behaviour without spending a single dollar of public money.
A similar disclosure-based accountability framework for S-REITs, targeting REITs with persistent gearing above a defined threshold or multi-year distribution decline, would cost nothing and signal clearly that Singapore’s reputation as a REIT centre rests on the quality of its REITs, not only the competitiveness of its listing infrastructure.
What the data is telling us
The persistent institutional-retail flow divergence is not the cause of the sector’s quality problem. It is the evidence of it. Grade A accounts for just 9.8% of listed REITs. A further 29.3% are selectively investable under specific conditions. The remaining 61%, more than half the sector by REIT count, are either fragile income or distressed. Institutional investors, who apply the kind of income-quality analysis described in this article before committing capital, have drawn their conclusion and expressed it through years of consistent net selling. The difference in outcomes between that group and the retail investors who have been buying will become visible in the next refinancing cycle, the next property revaluation or simply the next reporting period in which the majority of S-REITs fail again to maintain or grow their distributions.
For boards of the 25 REITs in the fragile income and distressed cohorts, the message from this data is direct. Institutional capital is not absent from these REITs because of sentiment or macro positioning. It is absent because specific, quantifiable criteria, income delivery, balance sheet discipline and distribution trajectory have been examined and found wanting. The window created by 2025’s supportive market conditions to address these fundamentals is a finite one. It does not remain open across refinancing cycles.
For policymakers, one question deserves a deliberate answer rather than a default outcome: does Singapore’s revitalisation agenda include a specific plan for the income infrastructure that makes its capital market internationally distinctive or only for the growth infrastructure it is building? Both are legitimate priorities. The data here suggests that only one is currently being addressed.
Singapore built something genuinely significant in its REIT sector, and the headline numbers confirm it. What the headline numbers do not show is that 61% of that sector, 25 of 41 REITs, falls into the fragile income or distressed categories on the metrics that yield investors should care most about. The retail investors buying on the basis of a 5.9% sector average deserve to know that the average is carried disproportionately by four institutional grade REITs holding 40.5% of the sector’s market capitalisation, and that institutional capital has been exiting for years.
The reform agenda currently under way was not designed with them in mind. That is not an indictment of the government’s intentions. It is a description of a gap that still needs to be closed.
Lee Ooi Keong is an independent director of a Mainboard-listed company with 30 years of experience in corporate performance, investments and risk management. He is also the founder and MD of Clover Point Consultants, an independent board and C-suite advisory firm. He was formerly the director of risk management at Temasek for over 16 years.