

Syfe, a Singapore robo-advisor, makes the case for the STI to investors in similar terms: steady dividends, policy stability and defensive sector exposure. Some market commentary warns that the local market is not very diversified because banks and property dominate it, but that view sits at the margins. None of the numbers behind the mainstream belief are wrong; the STI really did deliver those returns.
Our analysis finds the problem is not that this belief is false. It is that the three claims inside it — diversified, defensive and built on durable strength — all rest on the same thing: Singapore’s three local banks, and overwhelmingly one of them.
The diversification is mostly one name
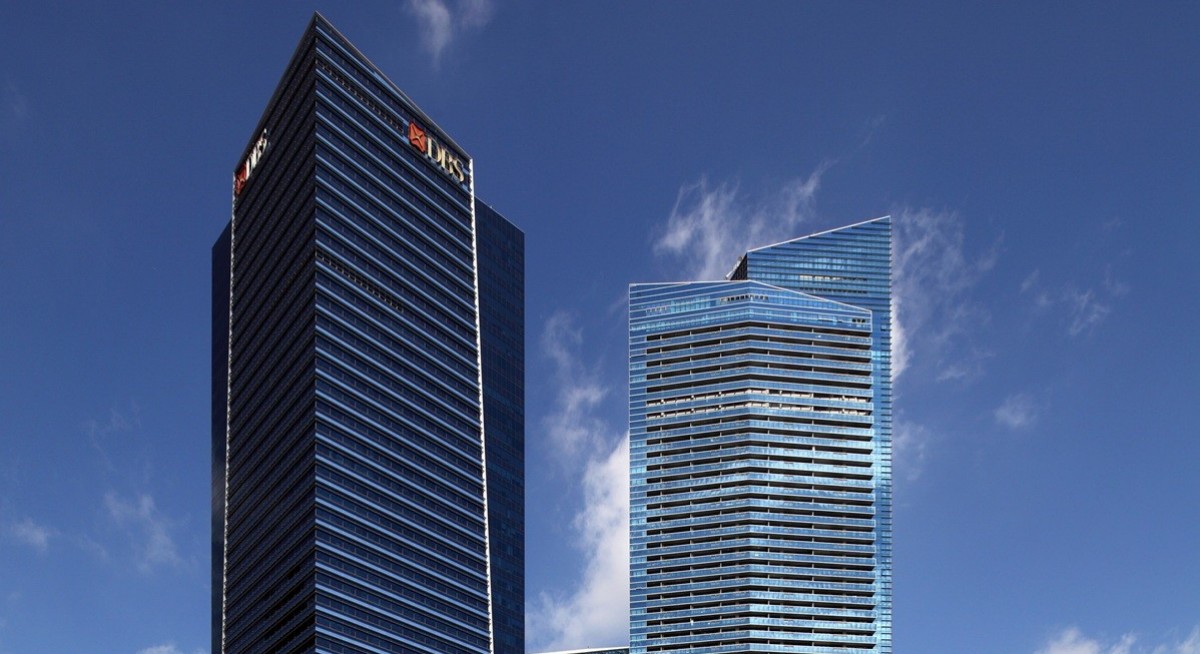
DBS Group Holdings carries 27.2% of the STI’s weight, while Oversea-Chinese Banking Corp (OCBC) holds 16.3% and United Overseas Bank (UOB), 9.9% (FTSE Russell, May 29). Together, the three banks are 53.4% of the index — more than half. The fourth-largest constituent is Singapore Telecommunications (Singtel), which holds 6.7% or about a quarter of DBS’s weight on its own, and from there the index trails into the single digits and below.
DBS alone outweighs the bottom 20 STI constituents combined, with 27.2% against 20.7%. A 10% move in DBS by itself moves the index by 148.8 points; the same 10% move applied to all 20 of the smallest constituents together moves it by 113.4 points. One stock, on its own, swings the index more than the bottom 20 of its 30 members combined (See Chart 1).
See also: South Korea to halt new listings of single stock leveraged ETFs

This is not an arithmetic curiosity. From the end of 2023 to June 14, 2026, the STI rose about 61%. The three banks rose 73.1% on average over the same period: DBS by 106.1%, OCBC by 79.5%, UOB by 33.8%. The other 27 constituents rose just 27.7% on average, and the share prices of 12 of them fell over the same period even as the index climbed to record highs.
Weighting each group by its actual share of the index, the three banks accounted for 65% of the combined gain across all 30 names, and the other 27 for 35% (See Chart 2). An investor who believed they owned a diversified basket of 30 Singapore blue chips owned, in substance, a basket dominated by one of them. The index is built across 30 names. The return it delivered came overwhelmingly from one, a concentration that also explains why the index’s reputation for safety does not hold up.
See also: SGX chalks up highest average daily trading value in 18 years

Defensive only in calm
The same three banks that drove the diversification problem also explain why the STI’s defensive reputation does not hold up in the crises that matter most. We examined every global risk-off episode since 2010 (17 in total). The STI fell in all 17; it has never sat out a global downturn. What differs sharply is how far it falls relative to the rest of the world. Eight of the 17 were cushioned: the STI fell on average by 7.6%, against an average 12.3% decline for global markets — a ratio of about 0.61, meaning it lost roughly six-tenths as much as the world. Seven showed close to full participation: the STI fell on average by 15.3% against a 16.3% world average — a ratio of about 0.94, meaning it lost almost as much as the world did. The remaining two showed even stronger protection, one a genuine decoupling where the STI barely fell at all (See Chart 3).

The belief that the STI is defensive rests on the idea that it should behave differently from global markets in a real crisis, because of what it holds, financials and other businesses seen as steady. The natural objection is that this is unremarkable: any large stock market falls when a genuine global crisis hits, so a degree of correlation proves nothing special. That objection is correct, and it is also the point. In the crises that actually mattered, the STI did not behave differently from the rest of the world. It behaved like the rest of the world.
When we examined the correlation between the STI and the world’s other major markets, one at a time, the STI’s strongest relationship with any of them is with Hong Kong’s Hang Seng, a correlation of 0.64. London’s FTSE follows at 0.62, Europe’s STOXX at 0.59, Wall Street’s S&P 500 at 0.55, and Shanghai Composite is the weakest at 0.33. A correlation of 0.64 squared gives an R-squared of about 0.41, meaning the Hang Seng alone explains about 41% of the STI’s weekly movement, leaving the majority unexplained by any single market.
We then ran a multivariate correlation analysis, testing the HSI, FTSE and S&P500 together rather than one at a time. Together, these global markets lift the combined correlation to 0.73, with an R-squared of 0.54, meaning they jointly explain 54% of the STI’s weekly movement, leaving 46% to factors specific to Singapore.
That relationship changes sharply with conditions. In calm periods, global markets explain only 38% of the STI’s moves. In volatile periods, that rises to 66%. Despite talk of deglobalisation and shifting trade routes, the world’s major financial markets remain tightly linked, so a serious shock in one large market still spreads quickly to the rest. The STI is no exception. DBS, OCBC and UOB are large, globally exposed financial institutions, not purely domestic businesses, and together they are more than half the index. Hence, when the three banks move with global markets in a crisis, so does the STI.
To stay ahead of Singapore and the region’s corporate and economic trends, click here for Latest Section
The record is one re-rating
Between 2007 and 2023, the STI’s price was essentially flat for 16 years, before breaking out in 2024 and 2025 to above 5,000. On a total-return basis, the index delivered about 54% across 2010 to 2021, almost entirely from dividends. The entire gain since then arrived in two years: 2024 and 2025 alone delivered a compounded total return of about 58.8%, more than the prior decade combined.
It is tempting to describe this as the market re-rating — in other words, the market deciding to pay more for the same dollar of profit. In fact, almost none of the market re-rated. Only one stock did.
From 2023 to 2025, DBS’s share price rose 86% while its earnings per share grew only 9%. The gap between those two numbers is the re-rating, and on these figures, it accounts for almost the entire move. DBS’s own net interest margin compressed over this period, from 2.14% in mid-2024 to 1.93% by late 2025, as falling rates pulled the Singapore Overnight Rate Average (SORA) benchmark down with them, a real reason group earnings dipped in FY2025 even as the share price kept climbing.
DBS deserves credit for what is, by its own disclosed numbers, a genuinely strong run. Return on equity reached 17.0% in the first quarter of 2026, above its own 15% to 17% target range and above its local and global peers. Wealth-management income grew 74% from 2022 to 2025, to $5.68 billion, now about a quarter of group income. This is well ahead of the bank’s 34% growth in net profit over the same period, from $8.19 billion to $11.0 billion. That fee-income growth held up even as falling rates squeezed the bank’s own net interest margin, which suggests it is a genuine business shift, not simply a byproduct of the rate cycle. None of this is in question.
The question is whether that genuine strength justifies the result. As of July 10, DBS trades at 2.88 times book value. OCBC trades at 1.93 times and UOB at 1.43 times, both also above their historical averages, but by less. DBS’s premium over its two domestic peers remains wider on valuation than on profitability: its return on equity (17.0%) is 47.2% above the average of OCBC and UOB (11.55%), but its valuation premium over the same two peers is 71.4%. The market is paying a bigger premium for DBS than the bank’s own profitability gap over its peers would justify (See Chart 4).

The comparison that should settle the question of whether this is simply how good banks get priced is JPMorgan, the most highly valued of the major US banks. JPMorgan currently trades at 2.61 times book value, with a return on equity of around 17% and a return on tangible equity of 20% in 2025, both comparable to, or ahead of DBS’s. JPMorgan is also roughly six times DBS’s market capitalisation in their respective currencies, with a far larger, more diversified global franchise spanning investment banking, trading and asset management. None of that scale, that diversification or that profitability edge currently justifies DBS trading richer than JPMorgan. DBS’s 2.88 times book is now above JPMorgan’s 2.61 times. A bank a fraction of JPMorgan’s size, with a comparable or slightly lower return on equity, is priced more richly than JPMorgan itself.
As a counterfactual (not a forecast), if DBS were valued at the average current 1.68 times price-to-book of its two domestic peers, instead of its own 2.88 times, its actual price of $70.45 (as of July 10) would imply $41.10 — a 41.7% reduction. At DBS’s 27.2% index weight, that alone would remove about 620 points from the STI — a decline of about 11.3% — taking the index from 5,469.29 to roughly 4,849.
Three claims, one bet
These three findings are one fact, not three.
The STI’s low correlation to global markets in calm periods, which reads as a defensive tilt, holds only because DBS, OCBC and UOB are themselves behaving calmly. When the three banks move with the world, so does the index, because together they are more than half of it.
When you look at where the actual gains came from, the 30-name breadth that reads as diversification turns out to be three names, and overwhelmingly one. Take DBS, OCBC and UOB out, and the period since 2023 becomes a story about 27 stocks, 12 of which fell — a mixed, unremarkable few years for the rest of the market, not the record-breaking run the index headline implies.
The record that reads as durable strength is one bank’s valuation re-rating, on top of a genuine but still-young shift toward fee income.
Diversification, defensiveness and strength are not three separate virtues that happen to sit beside DBS’s weight in the index. They are DBS’s weight in the index, described three times.
The STI is, in effect, a DBS tracker with 29 passengers.
It would be easy to call this a flaw in how the index is built, but that is not quite right. Market-capitalisation weighting is the standard methodology behind most major indices in the world, including the S&P 500 and the Hang Seng, and there is nothing wrong with the method itself. Concentration of this kind exists in most cap-weighted indices; the S&P 500’s top three holdings — Nvidia, Apple and Microsoft — are about 18% of that index; the STI’s top three are 53.4%, nearly three times as concentrated. What is unusual about the STI is the degree, not the principle.
The more useful question is what the method has revealed about the market it measures. SGX had a population of 601 listed securities as at the end of May 2026. Of those, only one, DBS, has grown large enough to command this scale of index weight on its own. The STI is not distorted by its construction. It is an accurate measurement of a market in which one company, by genuine achievement, has outgrown every other listed name, including its own two closest banking peers.
That points to a harder question than the index itself can answer: why, across 601 listed securities, has only one reached this scale, and what would it take for others to follow? Singapore’s policymakers and exchange have spent recent years trying to broaden market participation and deepen liquidity beyond the largest names. This evidence does not suggest that effort was misdirected. It suggests the gap it is working against is wider than an index review could close: it is a gap in how many companies the market itself has produced at scale, not a gap in how the index counts them.
That single gap produces three distinct consequences for investors, for the other 27 STI constituents and for regulators — not three separate complaints but three readings of the same underlying fact.
For an investor, the practical point is narrower. A holder who understands that their STI exposure is, in substance, a position in DBS, holds an asset priced on the right basis. A holder who believes they own a diversified, defensive basket of 30 blue chips does not.
For the other 27 STI constituents, the picture is structural rather than a failing of their own. Capital that flows into Singapore equities through the STI’s two tracking ETFs still reaches all 30 names, including the 27 outside banking, in proportion to their weight in the index. But as DBS’s weight has grown, a shrinking share of every dollar that flows through those funds is being directed toward anything the other 27 have actually done. The only way that changes is if some of those 27 grow large enough to command a meaningfully larger share, the same scarcity already identified above.
For regulators, the conclusion is the most serious of the three. As stated at the outset, the STI is the figure most Singaporeans, foreign investors and the financial press use to answer one question: how is the Singapore market doing. An index in which one company is worth more than 20 of the other 29 combined is not a reliable answer to that question. It is, increasingly, an answer to a narrower one, about how DBS is doing.
This is precisely the test the newly formed Equity Market Implementation Committee (EMIC), co-chaired by MAS and SGX to oversee implementation of the Equities Market Review Group’s reforms over the next 12 to 24 months, will face. If the EMIC’s own measures, the broker custody reforms, the board lot reduction, the EQDP capital, succeed in broadening participation among the smaller and mid-sized names, the STI’s headline level is the wrong place to look for proof, because that level will keep moving mostly in step with DBS. EMIC will need a scorecard that excludes the banks to know whether its own work is succeeding.
The record is real. The diversification and the defensive tilt are not — not in the way they are routinely described to everyone who holds this index, retail and institutional alike. An investor who buys the STI today is, in substance, making a concentrated bet on DBS, with the other 29 names along for the ride. That may be a perfectly reasonable bet to make. It is not the bet most of its holders have been told they are making.
Lee Ooi Keong is an independent director of an SGX Mainboard-listed company with 30 years of experience in corporate performance, investments and risk management. He is the founder and Managing Director of Clover Point Consultants, an independent Board and C-suite advisory firm, and was formerly Director of Risk Management at Temasek for over 16 years.