


The goal of this article is to score the components of STI to help investors filter for potentially undervalued stocks. If every stock is overvalued, it would be wise not to invest entirely in the benchmark. If every stock is undervalued, buying an exchange-traded fund (ETF) that tracks the STI may be a good idea, but investing individually in the most undervalued stocks may be more strategic. If every stock were fairly valued, investors could add them to a watchlist and track them.
Regardless of the valuation, more attention should be given to stocks that move significantly in price or whose results announcements are nearing, because determining whether a stock is undervalued requires recognising a disparity between its value and price. The stock’s value is likely to change after the results or any major company announcement. The price, on the other hand, can move for a variety of reasons, but tracking stock beta can be one way to filter these companies.
For the STI, companies can be scored using purely quantitative metrics as an initial filter before investors decide to study them qualitatively. Every company or business is practically different, even if they are in the same sector or industry. However, certain quantitative metrics can generally be used for most stocks, excluding banks and REITs, as their key valuation metrics can differ substantially.
Table 1 lists the non-bank and non-REIT constituents of the STI that are quantitatively scored. The scoring table considers the following six quantitative aspects:
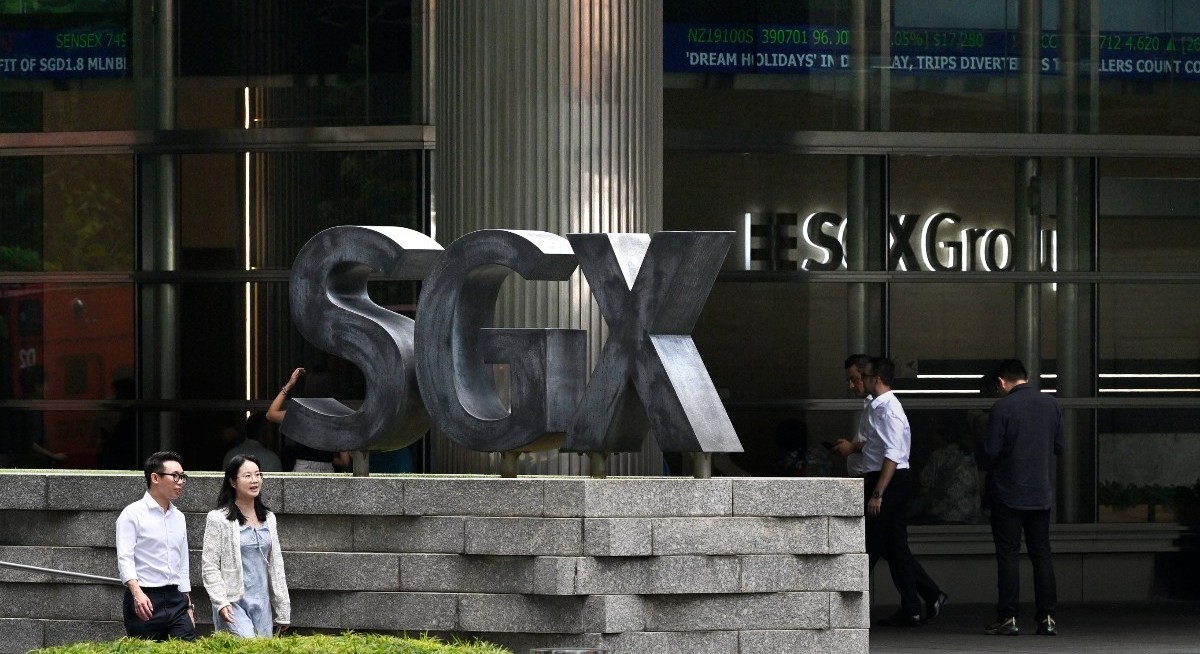
See also: With no ‘sell in May’, SGX enjoys higher target prices on ‘strong’ May


Historical performance looks at the company’s financials over the past 10 years or since inception, with discounts applied for poor performance and inconsistency.
See also: DBS lays out case for DFI Retail to move ahead with Hong Kong supermarket consolidation
Profitability is measured by ratios such as return on equity, return on assets and margins.
Yields and relative valuation compare the company’s fundamental yields against the risk-free rate and its relative valuation to peers.
Financial safety examines the company’s balance sheet, including liquidity and solvency ratios, the quality of its shareholder equity, and any external credit rating assigned to the company.
Sentiment looks at analyst ratings and forward price ratios on the company.
Price-to-value analysis compares price growth to weighted value growth across multiple periods. This weighted value includes revenue, net income and cash flows in ascending order.
According to the scoring table, Genting Singapore, Thai Beverage, and UOL Group are the most undervalued. For dividend-based investors, Table 2 shows the current and forward dividend yield of all 30 STI constituents. For REITs, Mapletree Industrial Trust is the most attractive; for banks, it is DBS Group Holdings; and for the rest, it is Thai Beverage.


